

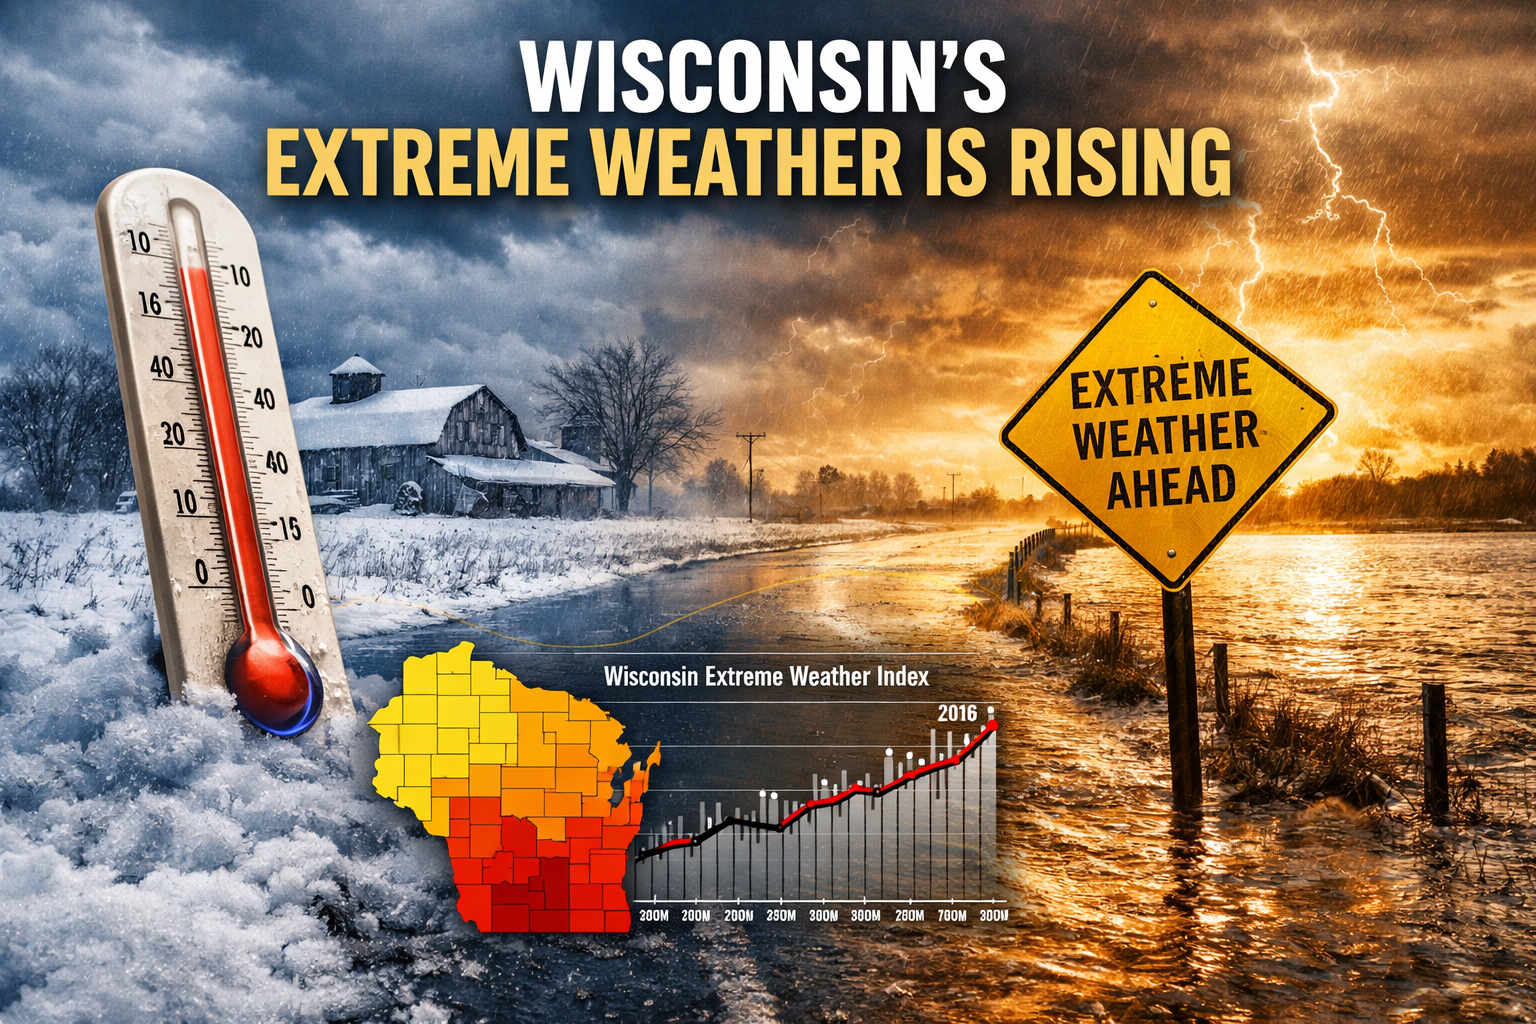
Wisconsin’s weather is becoming more extreme, and the trend is no longer subtle.
New research from the Wisconsin State Climatology Office shows a clear and sustained increase in extreme weather across the state dating back more than a century. The findings are based on the Extreme Weather Index, or EWI, a metric designed to capture how unusual Wisconsin’s temperature and precipitation patterns have become over time.
The takeaway is simple. Extreme weather in Wisconsin is increasing, and winter is playing the biggest role.
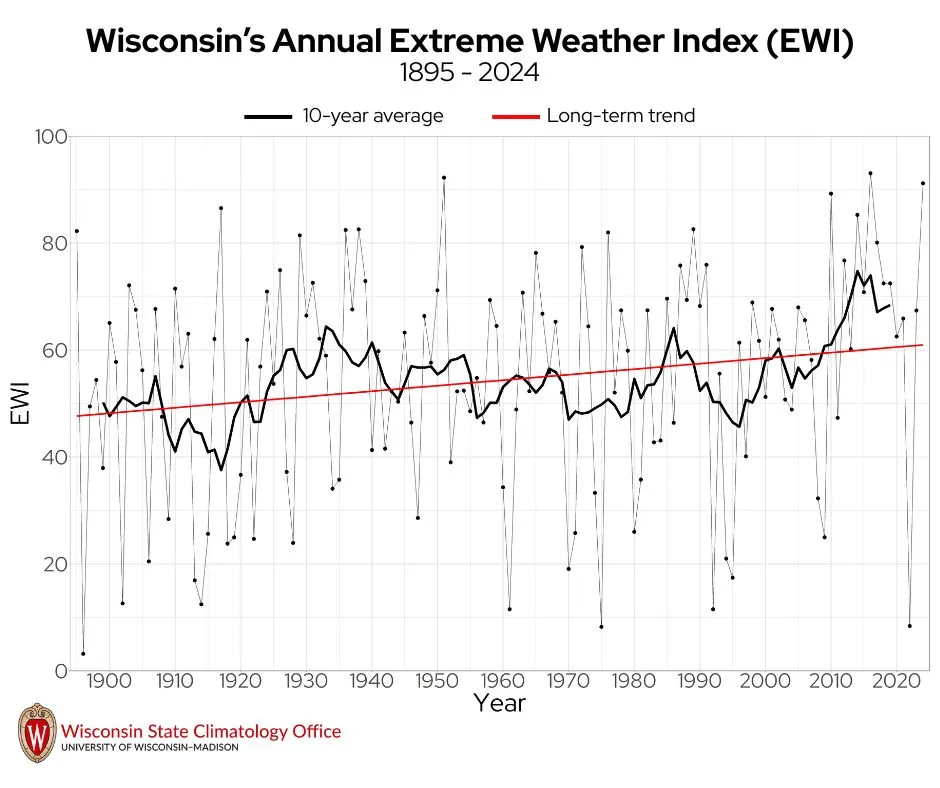
“Wisconsin’s EWI shows a long-term upward trend of about 28 percent since data became available in 1895.”
What Is the Extreme Weather Index (EWI)?
The EWI combines temperature and precipitation anomalies into a single number that reflects how unusual conditions are compared with long-term historical records.
The index equally weights temperature and precipitation across time scales ranging from one month to one year. A value of zero represents average conditions. A value of 100 represents record-breaking extremes in both temperature and precipitation.
When averaged statewide on an annual basis, Wisconsin’s EWI shows a clear upward trend that has accelerated in recent decades.
“The state’s highest Extreme Weather Index occurred during the 2010s, reflecting Wisconsin’s wettest and second-warmest decade on record.”
Winter Is Driving the Increase
While all seasons contribute to the rising trend, winter stands out.
December through February has seen increasingly warm and wet conditions, which has pushed Wisconsin’s overall EWI higher than any other season. Warmer winters mean more precipitation falls as rain rather than snow, more frequent freeze-thaw cycles, and greater variability from year to year.
These winter shifts have broad impacts, from infrastructure stress and road damage to changes in snow cover, ice duration, and water runoff.
“Winter is the season that has contributed the most to the annual EWI trend due to increasingly warm and wet conditions.”
Not All Parts of Wisconsin Are Changing Equally
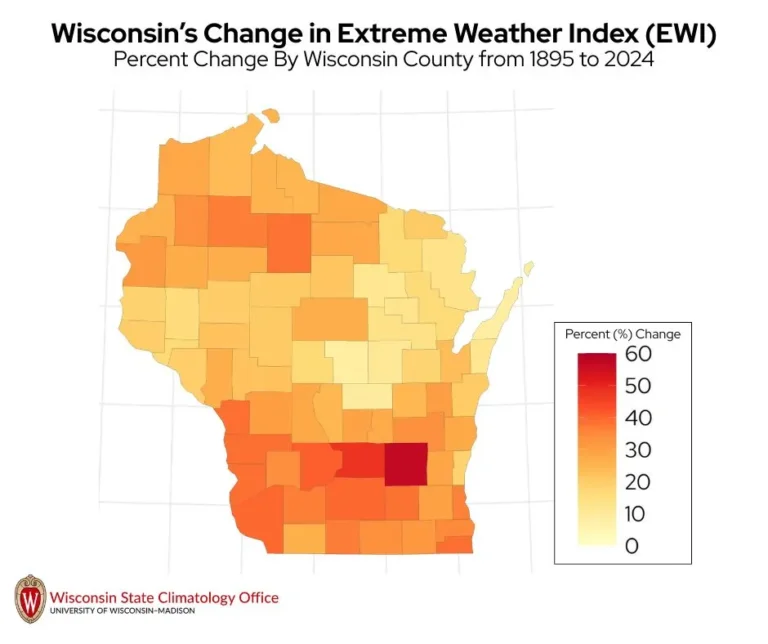
The increase in extreme weather is not uniform across the state.
Southern Wisconsin has experienced the largest rise in the Extreme Weather Index, particularly in the south-central region. That area has seen increases approaching 46 percent since records began.
Dodge County shows the strongest trend, with an increase of more than 50 percent, followed closely by Columbia County. In contrast, parts of northeastern Wisconsin show smaller increases, though the trend there is still upward.
“The largest increases in extreme weather have occurred in south-central Wisconsin, with some counties seeing changes greater than 50 percent.”
How Wisconsin Compares Nationally
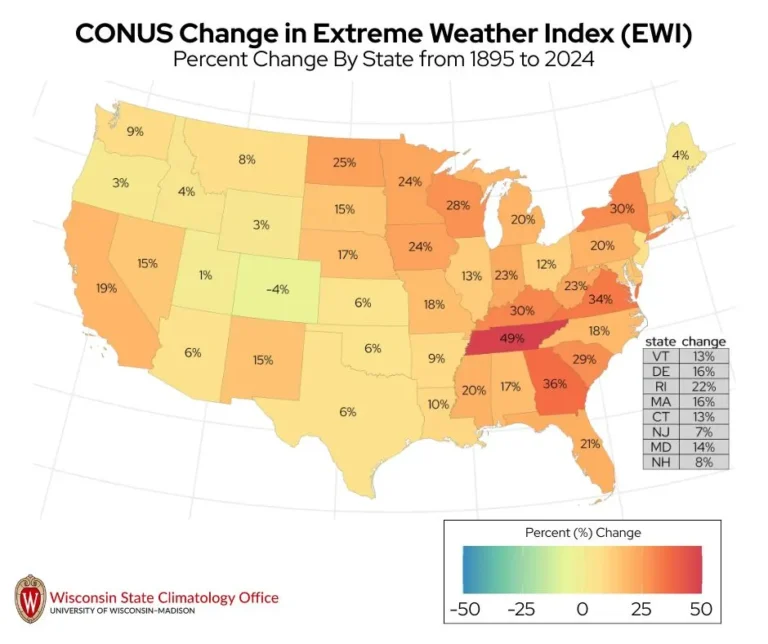
Wisconsin’s increase in extreme weather stands out beyond the Midwest.
When compared with the rest of the country, Wisconsin ranks sixth nationally for the largest increase in the EWI. It has experienced the greatest rise of any Midwestern state.
Only five states have seen larger increases overall: South Carolina, New York, Virginia, Georgia, and Tennessee. Colorado is the only state that does not show an upward trend.
“Wisconsin ranks sixth nationally for the largest increase in extreme weather since 1895.”
Why This Matters
The EWI does not point to one single storm or event. Instead, it reflects a long-term shift toward more frequent and more intense departures from normal conditions.
For Wisconsin, that means heavier precipitation events, warmer winters, and greater variability that challenges agriculture, infrastructure, water management, and daily life.
The trend is clear, measurable, and ongoing. Extreme weather is becoming a bigger part of Wisconsin’s climate story, with winter leading the charge.
By the Numbers: Wisconsin’s Extreme Weather
- 1895
The year statewide EWI data begins in Wisconsin. - 28 percent
The overall increase in Wisconsin’s EWI since records began. - 2010s
The decade with Wisconsin’s highest Extreme Weather Index, marking the wettest and second-warmest decade on record. - Winter (December to February)
The season contributing the most to the long-term rise in extreme weather due to warmer and wetter conditions. - 46 percent
The increase in across south-central Wisconsin since 1895. - 50 percent plus
The rise in EWI observed in Dodge County, the highest increase in the state. - 6th
Wisconsin’s national rank for the largest increase in extreme weather among U.S. states. - 1
The number of states without an upward EWI trend: Colorado.
